Report blocks
A report block is one chart, table or panel inside a report. A report is a stack of blocks, read from top to bottom, and each block answers one question: which ads spent the most, how a metric moved over time, how many assets your team added to the library each week. Each block has its own settings, such as its metrics, breakdown, filters and timeframe, so one report can mix several views of the same data.
Blocks come in two groups. Performance blocks read data from the ad accounts connected to the report. Production blocks read from your asset library. A report can hold any mix of them, up to 15 blocks.
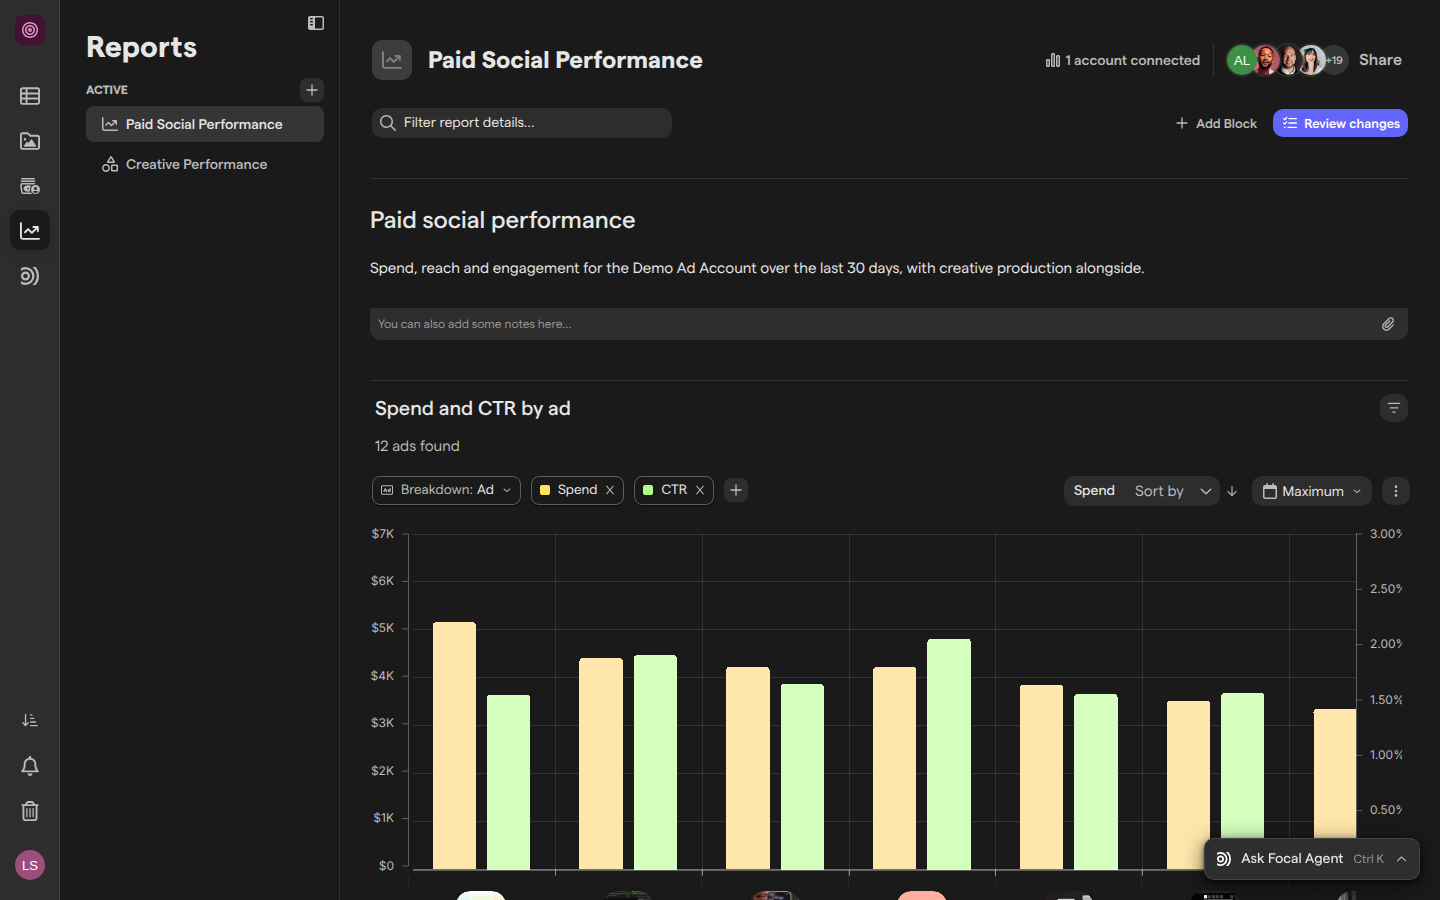
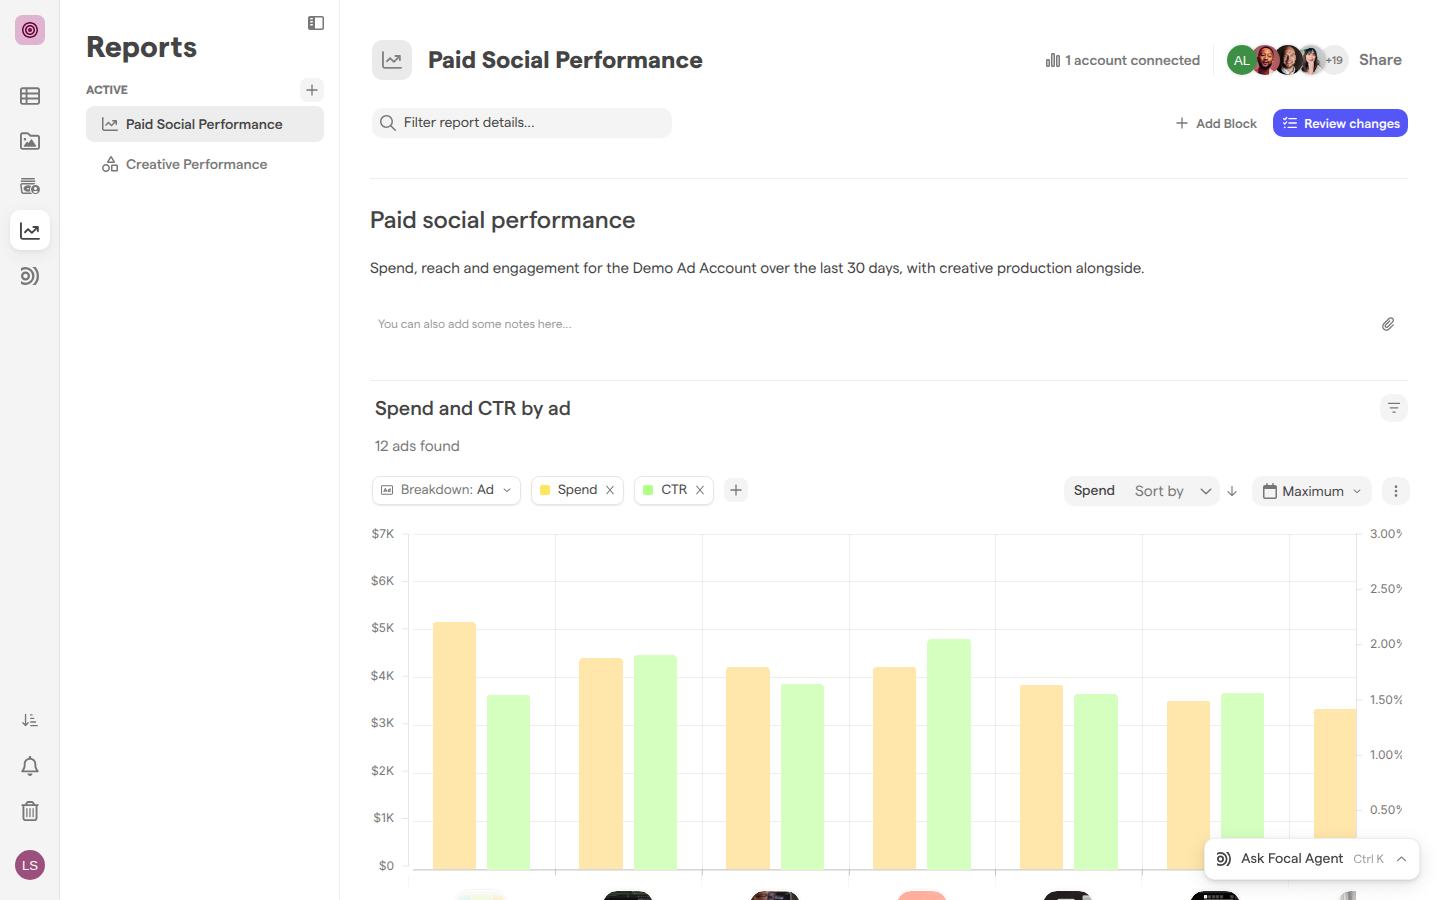
Add a block
A new block is added at the end of the report. Blocks that read ad data need an ad account connected to the report first (see Creating a report).
- Open the report from Reports in the sidebar.
- Click Add Block in the report header.
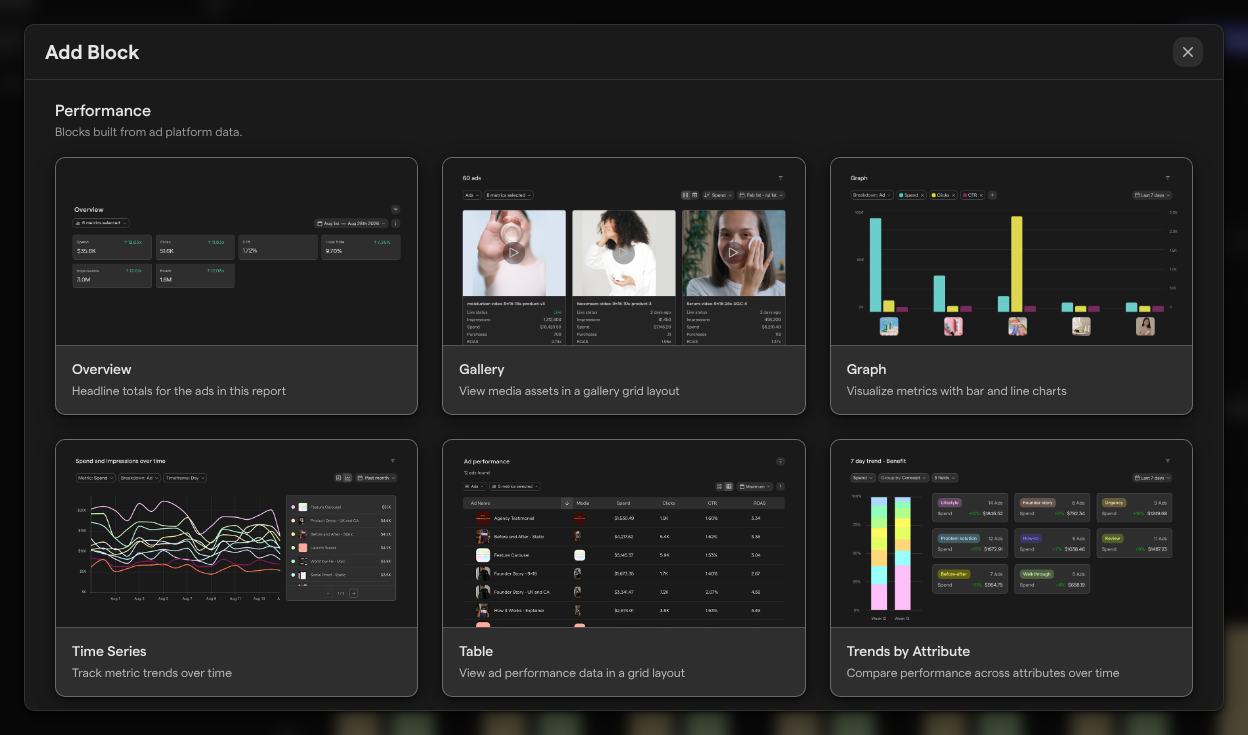
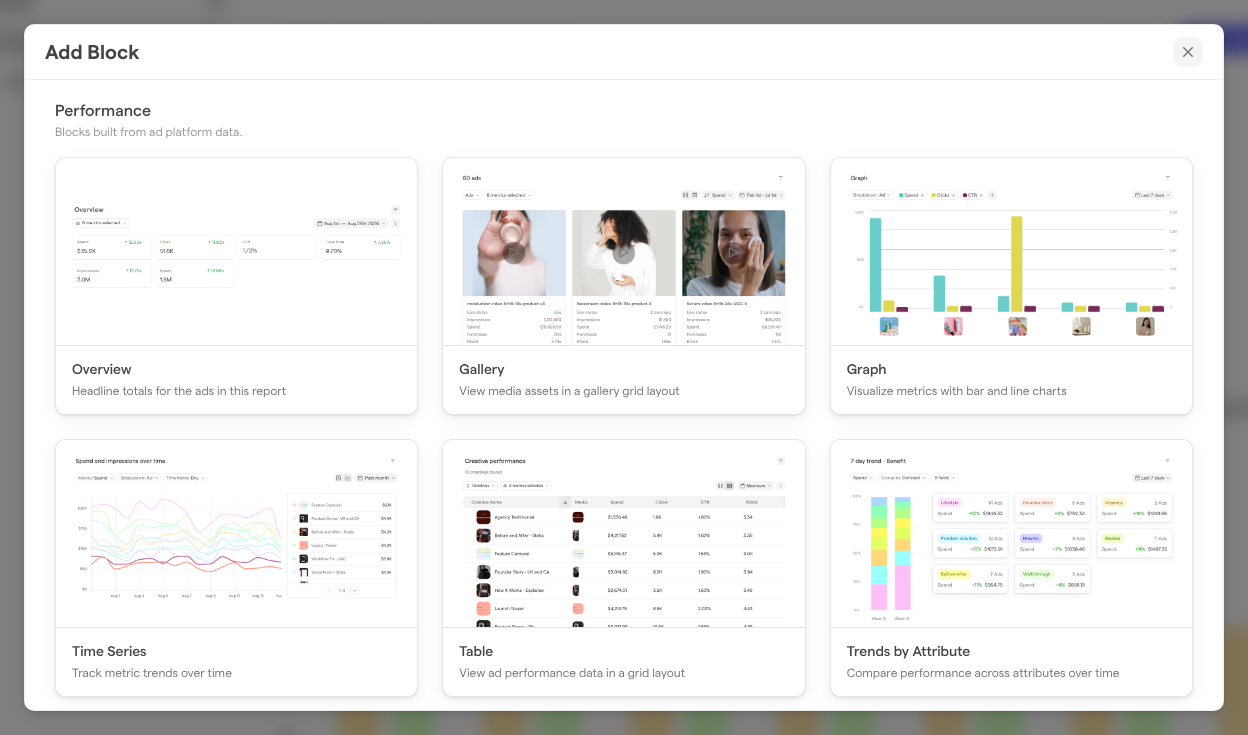
- In the Add Block window, click the card of the block you want.
A report with no blocks shows the same cards straight away, under “Add your first block”, so you can pick the first block without opening the window. A new block starts with the timeframe of the block you changed most recently.
Adding a block is a change to the report like any other: it is listed under Review changes until someone with Edit or Full access saves it. See Managing reports.
Note: A performance block shows “Connect an ad account” until the report has one, and “Your data is being imported” while the first five days of data sync.
Choose a block type
The Add Block window lists the block types in two groups. Gallery and Table add the same kind of block, starting in a different view.
| Block | Group | What it shows |
|---|---|---|
| Gallery | Performance | A card for each ad, with its media and metrics |
| Graph | Performance | Bars comparing up to four metrics across ads, creatives, media or a media attribute |
| Time Series | Performance | One metric over time, day by day or grouped by week, month or quarter |
| Table | Performance | Ads with one column per metric and a totals line |
| Trends by Attribute | Performance | Performance per value of a media attribute, this period against the previous one |
| Production Timeseries | Production | How many assets the team added to the library over time |
Read a Table block
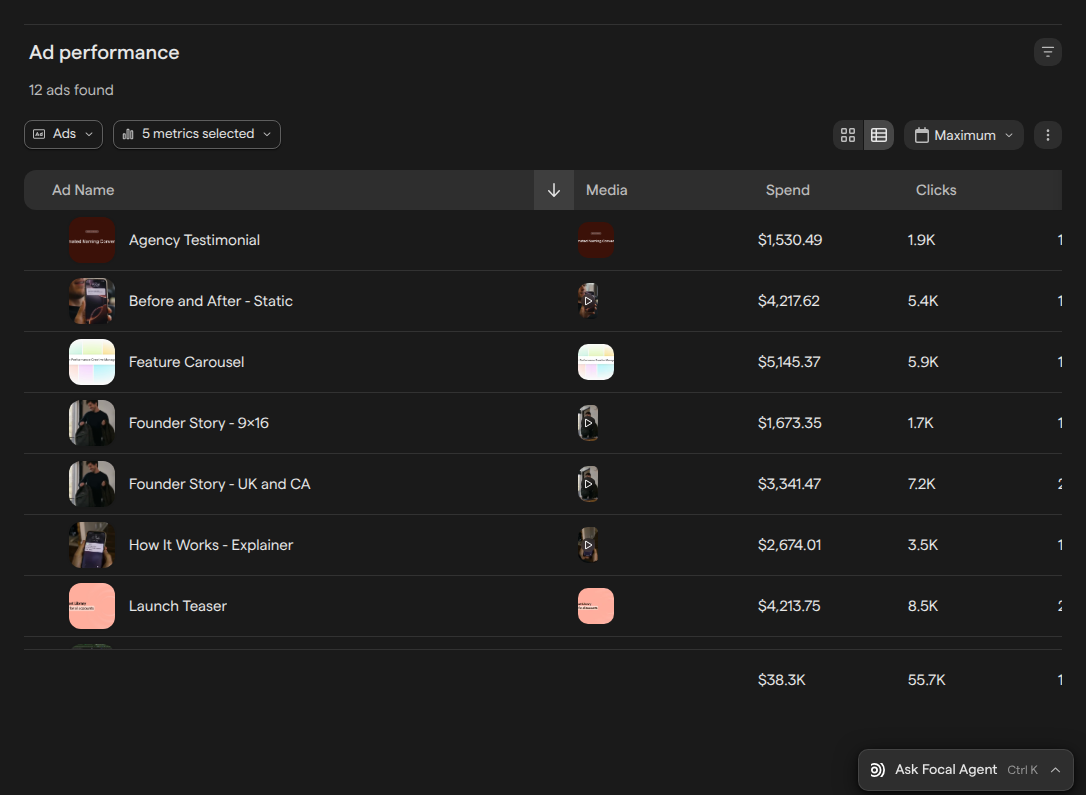
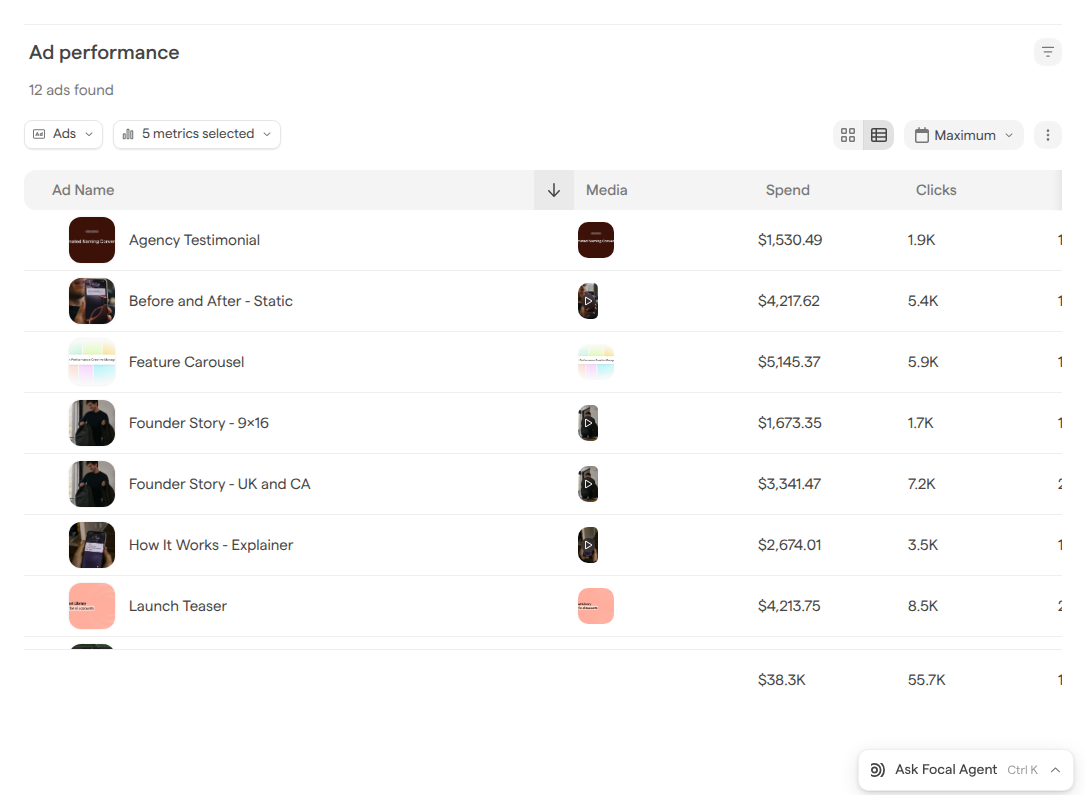
A Table block lists the ads, creatives or media in the report with their metrics. It has two views, switched with the two buttons at the top right of the block: Gallery shows a card for each ad with its metrics, and the table view (the button’s tooltip says “Grid”) shows one line per ad.
-
Breakdown. The first control picks what each line is:
- Ads (“Standard breakdown by ad.”)
- Creatives (“Group by creative visual”)
- Media (“Grouped by library media in Focal”)
The count above it follows, for example “12 ads found”.
-
Sort. In the table view, click the arrow in a column header to sort by that column. The gallery view has a Sort by menu and a direction button.
-
Totals. The last line of the table adds up each metric, with a badge comparing it to the previous period of the same length.
Click an ad to open its detail window, described in Ads and creatives. With the Media breakdown, a click opens the asset. Switching between the views changes only what you see.
Read Graph, Time Series and Trends by Attribute blocks
These three performance blocks chart ad data in different ways.
-
Graph draws bars for each ad, creative, media or media attribute value, picked with Breakdown:. Each metric is a chip: click + to add one, up to four, click a chip to change its color, and click its × to take it off. When two metrics use different units, such as spend and CTR, the second gets its own axis on the right. Sort by orders the bars.
-
Time Series shows one metric at a time over the dates, picked with Metric:. Breakdown: splits it by ad, creative, media or a media attribute, and Timeframe: sets how dates are grouped:
- Day
- Week
- Month
- Quarter
Switch between Stacked bar chart and Line chart, plus Percentage breakdown when broken down by a media attribute. Hide empty dates drops days with no data.
-
Trends by Attribute groups ads by a media attribute, picked with Group by. The chart compares each value’s share of the chosen metric, Previous against Current, and a card for each value shows its number of ads and the metrics picked under the fields button (for example 4 fields). Click a card to open the attribute’s breakdown window, described in Ads and creatives.
Track production with Production Timeseries
A Production Timeseries block counts what your team makes, from the asset library, without an ad account. Pick its metric from the button at its top left:
- Assets added to library
- Concepts added to library, the number of distinct concept IDs among your assets. It appears once the space has at least one creative ID pattern
- Comments on assets
- Mean versions per asset
Timeframe groups the dates by day, week, month or quarter, and Breakdown splits the count by a media attribute or shows All. It has the same chart and Hide empty dates controls as a Time Series block, and a list of totals beside the chart.
Choose a block’s metrics and breakdown
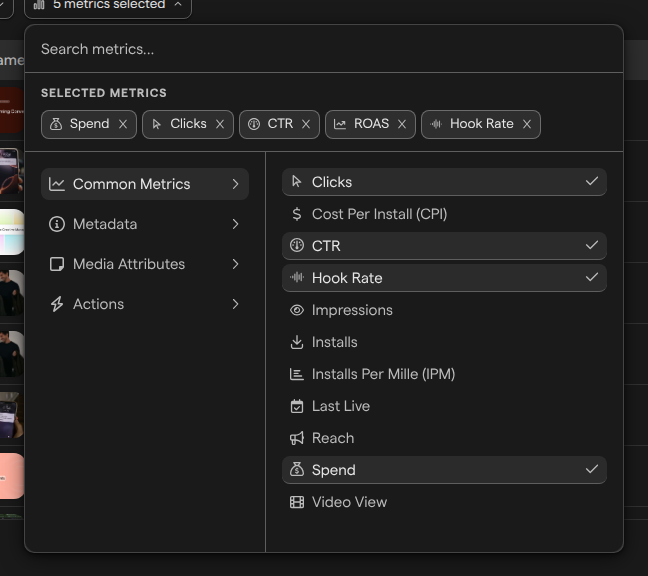
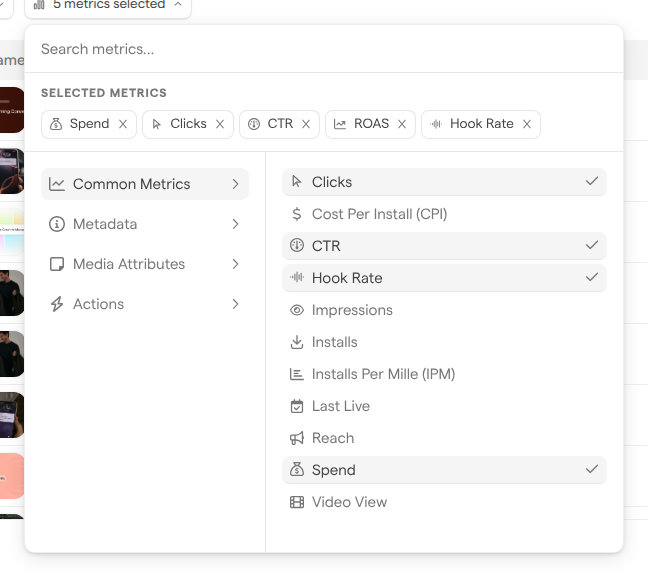
Metrics are the numbers a block shows, such as Spend, CTR or ROAS. The metrics picker opens from a block’s metric control: 5 metrics selected on a Table block, + on a Graph, Metric: on a Time Series, and the metric button or the fields button on Trends by Attribute.
- Open the block’s metric control.
- Search with “Search metrics…” or browse the groups on the left, such as Common Metrics.
- Click a metric to add it. Click it again, or its × under Selected metrics, to take it off.
The breakdown decides what each bar, line or card stands for: ads, creatives, media or the values of a media attribute. It is the Breakdown: control on most blocks and Group by on Trends by Attribute.
Filter a block
A block filter narrows one block without changing the rest of the report. Click the filter button at the top right of the block (“Filters for this block”) and pick a filter. Performance blocks can filter on metrics such as Spend…, ad accounts, launch date, ad name and status, campaigns, ad sets and media attributes. The status values are Live, Paused and Not Launched Yet. A Production Timeseries block filters on media attributes only.
Filters set for the whole report with “Filter report details…” apply to every block. A filter already set there is greyed out in the block, with “Already filtered at the report level”. See Managing reports.
Set a block’s timeframe
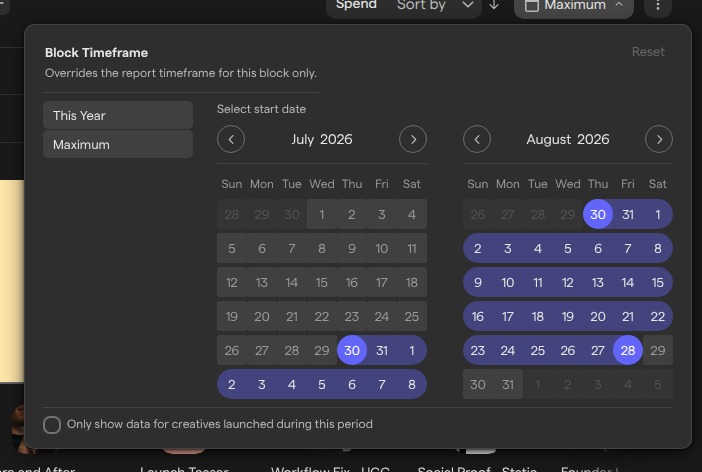
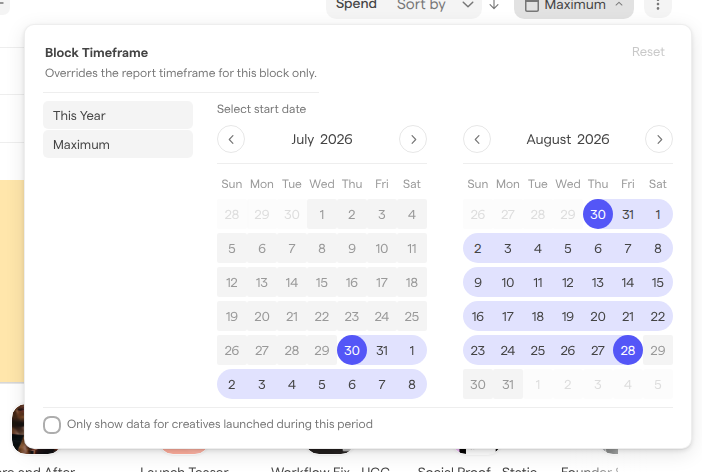
A block’s timeframe is the date range it shows. Every block follows the report’s timeframe until you give it its own. The control at the top right of the block shows the current range, such as Maximum.
- Click the timeframe control on the block.
- Pick a quick range, such as This Year or Maximum, or click a start and an end date in the calendar.
- To count only creatives that started running inside the range, turn on “Only show data for creatives launched during this period”. The control then reads “Launched …”.
Reset undoes what you changed since opening the popover. Dates with no synced data can’t be picked. A Production Timeseries block isn’t limited to the ad account’s dates.
Rename, move or remove a block
A block’s title sits at its top left. To rename a block, click the title and type. Trends by Attribute and Production Timeseries blocks name themselves from their settings, for example “Weekly Production by Format”.
To move or remove a block, open the ⋮ menu at the block’s top right:
- Move Up and Move Down swap the block with its neighbour.
- Remove Block asks “Are you sure?” first, because removing the block deletes it from the report.
Moves and removals are listed under Review changes like any other edit, and Reset there brings a removed block back. Once the change is saved, the block can’t be restored.
Who can change blocks
Report access decides what each person can do with blocks. People with Full or Edit access can add, change, move and remove blocks. People with View access see the blocks but no ⋮ menu, a disabled Add Block and locked filters (“You need edit access to change the filters on this report”). Edit and Full access save the changes for everyone. See Sharing reports.
Block limits
- A report holds at most 15 blocks. Past that, the cards in the Add Block window are disabled.
- A Graph block shows at most four metrics.
- Time Series and Production Timeseries blocks show one metric at a time: picking another replaces it.
- A metrics picker adds at most 10 metrics (“Only 10 metrics can be added at a time”).