Reports
A report is a page in a space that shows how your ads and creatives perform in your connected ad accounts, next to what your team produced. A report is built from blocks, such as a bar chart of spend by ad, a table of creatives or a count of the assets added to the library each week, stacked from top to bottom. Behind every ad and creative in a block is a detail window with its preview, its metrics and the assets it was made from.
Reports open from Reports in the app’s main navigation, or through Reports. The Reports sidebar lists the space’s reports under Active, and the report you pick opens beside it. Reports appears when reports are turned on for your organization, and never for guests (see Navigation). The numbers come from ad accounts, such as a Meta ad account, that your organization connects to Focal; see Ad accounts.
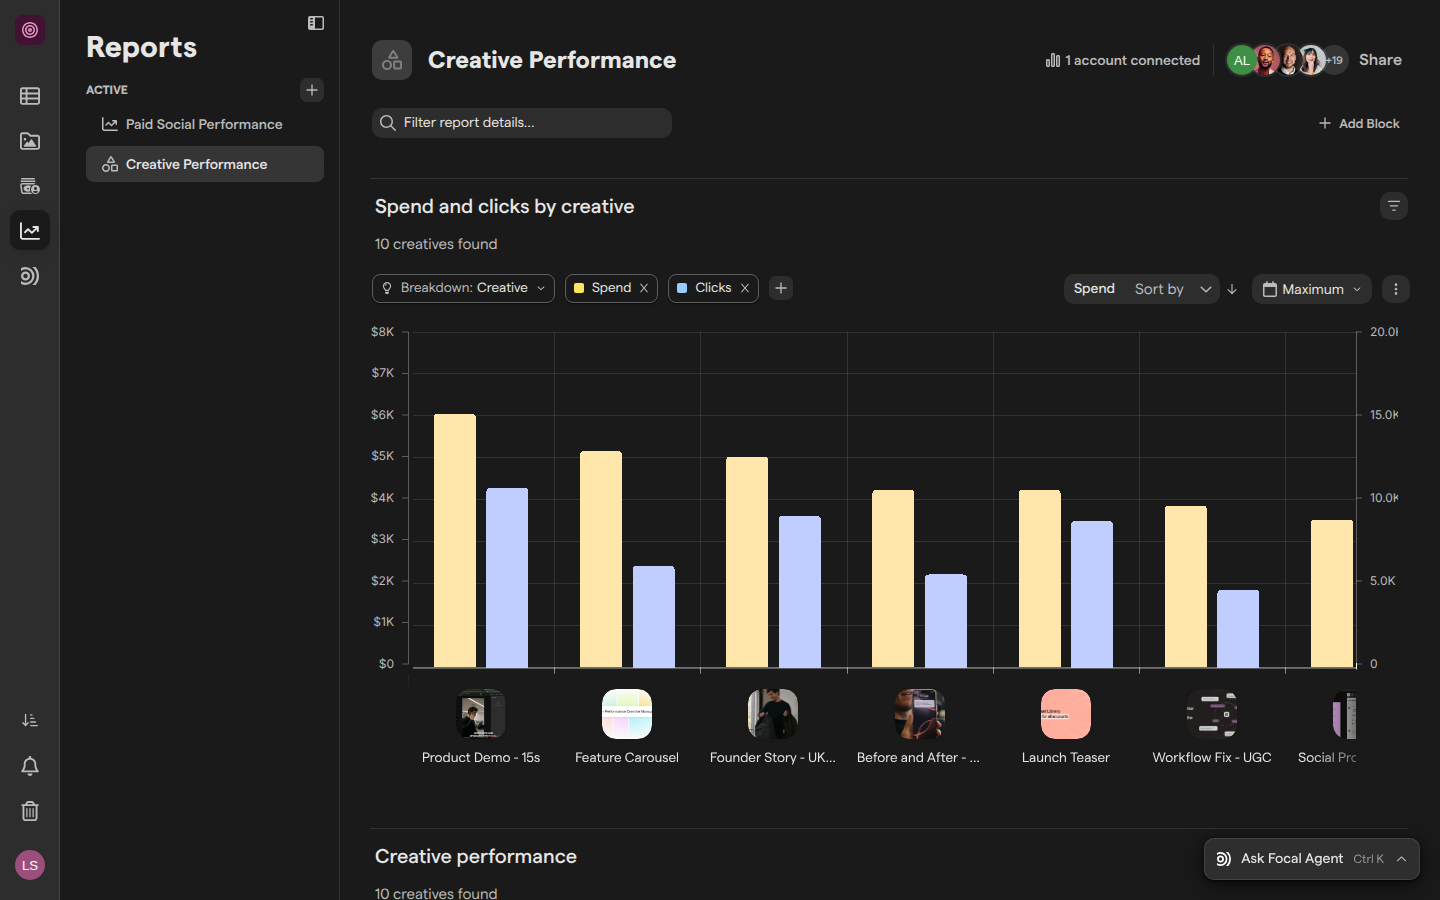
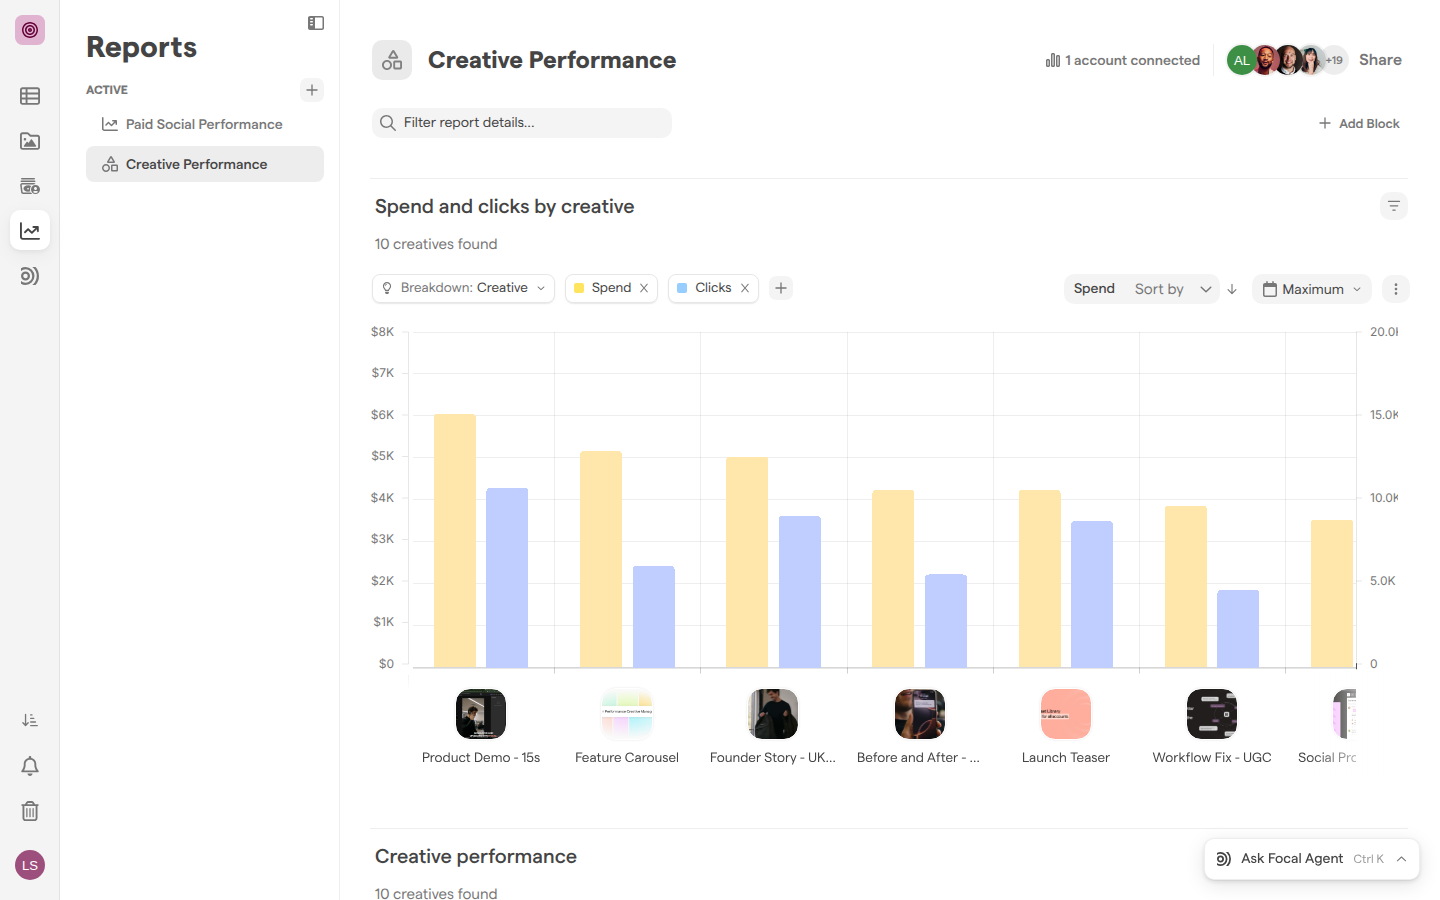
How a report is put together
A report in Focal is built from a few parts, each covered by an article in this section:
- Ad accounts are the advertising accounts a report reads its campaigns, ads and numbers from. An ad account is connected to Focal once, for the organization, and then added to each report that should use it from the button in the report’s header, such as 1 account connected. A newly connected account takes a while to import its data before the blocks fill in.
- Blocks are the charts, tables and panels of a report, up to 15 per report. The Add Block window groups them into Performance, “Blocks built from ad platform data.”, and Production, “Blocks built from your media library.” Gallery, Graph, Time Series, Table and Trends by Attribute read the report’s ad accounts. Production Timeseries counts what your team adds to the library. Each block has its own metrics, breakdown, filters and timeframe.
- Ads and creatives open in detail windows. Click an ad in a block for the ad window: its preview, where it runs, its headline and text, and its metrics. Click a creative, the visual an ad uses, for its totals across every ad that runs it. Connect to Library links a creative to the asset in your library it came from.
- Filters and timeframes narrow what the blocks show. Filter report details… filters every block at once, and each block can have its own filters and its own Block Timeframe.
Changes to a report are staged, not saved as you make them. Someone with Edit Access or Full Access to the report reviews them under Review changes and saves them for everyone. Each report is shared with people one by one, with Full Access, Edit Access or View Access, and space owners and organization admins always have Full Access. A report can be duplicated as a starting point for another. Permanently deleting a report cannot be undone.
What teams use reports for
Teams use reports to see which content works in their ad campaigns, and to put those results next to the work that produced them.
A performance marketer keeps a weekly report on a channel, like the seeded “Paid Social Performance” report: a bar chart of spend and CTR by ad, spend over time, spend by format, a table of every ad and the creatives currently running. When one ad stands out, they open it in the ad window to see its placements and the audience it reached, without leaving Focal for the ad platform. A creative strategist compares creatives in a report like “Creative Performance”, then uses Trends by Attribute or the Metrics by attributes window to check whether one value of a media attribute, such as UGC against static, performs better across a campaign.
Creative and production leads use reports to follow output as well as results. A Production Timeseries block shows how many assets the team added to the library each week, or how many concepts once the space uses creative IDs, next to how those assets perform once they run. Because creatives are linked to their assets, the team goes from a creative in a report to its original asset in the library without searching for it.
Reports are shared with the people who follow the results. A team lead can give leadership View Access to a campaign report, and keep the right to change it with the people who have Edit Access or Full Access.
The same ad data is used outside reports. The Ad performance reaches a value trigger starts a workflow when an ad passes a limit, the asset library’s search can filter assets by the results of the ads they run in, and an AI assistant connected through MCP can look up ad performance.
Articles in Reports
The Reports section has one article for starting a report, one for looking after it, reference articles for blocks and the detail windows, and one for sharing.
| Article | What it covers |
|---|---|
| Creating a report | Create a report, connect an ad account to it or connect a new one from Meta, set the timeframe, and what blocks show while an account’s data is imported |
| Managing reports | Find, rename and filter a report, review and save its changes, reorder, duplicate and permanently delete reports |
| Report blocks | The block types, adding a block, choosing its metrics and breakdown, filtering it, setting its timeframe, and moving or removing it |
| Ads and creatives | The ad window and the creative window, demographics, placements and video retention, metrics by attribute, and connecting a creative to its asset in the library |
| Sharing reports | The access levels, sharing a report with people and by email, the access for everyone in the space, and what guests see |